

Dollar-Cost Averaging Explained
Dollar-cost averaging (DCA) means investing the same dollar amount on a fixed schedule, such as $500 every month, whatever the price. A fixed amount buys more units when prices are low and fewer when they are high, so your average cost per unit ends up below the average of the prices you paid. In our hypothetical 12-month example, $6,000 buys 128.6488 units at an average cost of $46.64 while the average price was $47.04. DCA lowers the risk of investing everything just before a fall, but a lump sum tends to come out ahead when prices rise. Dollar cost averaging Canada-wide costs least at the seven brokers that charge $0 commission per online Canadian stock or ETF trade.
 Written by Sharad Gondaliya, CPA CPAChartered Professional Accountant, CPA Ontario No. 61040184
 Financial reviewer: Neha Gupta, CFA CFA charterholderReview of this page scheduled
At a glance
What it is. Dollar-cost averaging is investing a fixed dollar amount at regular intervals, regardless of price. In Canada it usually means an automatic transfer each payday into a TFSA, RRSP, FHSA or robo-advisor account, followed by a purchase.
Why the average cost is lower. Equal dollar amounts buy more units at low prices. In our hypothetical 12 months, the average price was $47.04 but the average cost per unit was $46.64, because 12.5 units were bought at $40 and only 9.0909 at $55.
DCA vs lump sum. In our hypothetical steadily rising market, $12,000 invested at once ends $1,422.37 ahead of $1,000 a month. In a market that falls then recovers, $1,000 a month ends $2,809.05 ahead. DCA trades some expected growth for less timing risk.
Automatic purchases. Wealthsimple lets you schedule purchases of stocks, ETFs or crypto on a daily, weekly, two-week or monthly cycle. Robo-advisors invest each deposit for you. At other brokers you can automate the deposit and place the trade yourself.
Commissions matter for small amounts. Twelve $500 purchases a year cost $0 in commissions at seven brokers (Webull adds a $0.70 monthly account fee, $8.40 a year), $12.00 at Interactive Brokers, $83.40 at CIBC Investor’s Edge and $119.88 at TD Direct Investing or Scotia iTRADE, which is 2.0% of every $500 purchase at $9.99.
Fractional shares help. Without fractional shares, part of each fixed amount sits as cash. Wealthsimple sells fractional shares from $1 commission-free, and CIBC Investor’s Edge’s online fractional trades are commission-free until October 31, 2027.
The stock average calculator below finds your average price per share across any number of purchases, with and without commissions, and the shares needed to bring the average down to a target.
About the numbers. The unit prices in our tables are made up purely to show how the arithmetic works; they are not the prices of any real fund. Where a table shows long-term growth, it assumes one of three hypothetical yearly returns, 3%, 5% or 7%, with monthly compounding (the setting our compound interest calculator uses) and nothing taken off for fees, tax or inflation. None of these is a forecast or a past result, and real returns can be negative. Our pages on investing $100,000 and on asset allocation use the identical rate set.
1. What Is Dollar Cost Averaging?
The definition. Dollar-cost averaging is a way of buying, not a type of investment. You pick an amount, a schedule and what to buy, then buy that amount on every scheduled date without trying to judge whether the price is high or low. The amount stays fixed; the number of units changes with the price.
Two situations, one method. Most people use DCA without naming it: putting part of each paycheque into a TFSA or RRSP every two weeks is dollar-cost averaging. The term also describes a deliberate choice to spread a lump sum, such as an inheritance or a bonus, over several months instead of investing it at once. The first is simply investing as money arrives. The second is a decision with a trade-off, covered in section 3.
What you can apply it to. DCA works with anything you can buy in small, repeated amounts: an all-in-one ETF, a set of index ETFs, a mutual fund through a pre-authorized contribution, or a robo-advisor portfolio. It is most useful for diversified funds that you intend to hold for years. Applied to a single stock, it can mean steadily adding to a company whose price is falling for good reason.
The opposite approaches. The alternatives are investing a lump sum all at once, or trying to time the market by waiting for a dip. DCA sits in between: it invests everything eventually, on a schedule set in advance. Our guides to how to invest in Canada and index investing explain what to buy; this page explains the buying schedule.
A word on the name. You will see it written with a hyphen (dollar-cost averaging) and without (dollar cost averaging), and shortened to DCA. They mean the same thing. In Canadian fund and bank material, the scheduled contribution behind it is often called a pre-authorized or systematic contribution, the wording TD Direct Investing uses in its fee schedule.
2. A 12-Month Dollar-Cost Averaging Table
The set-up. An investor puts $500 into the same fund on the first trading day of each month for 12 months. The unit price moves from $50 down to $40 and back up to $55. There are no commissions, and fractional units are allowed. Units bought each month are $500 divided by that month’s price; the averages come from the same formula as our stock average calculator.
| Month | Unit price | Units bought | Units held | Total invested | Value at that month’s price |
|---|---|---|---|---|---|
| 1 | $50.00 | 10.0000 | 10.0000 | $500.00 | $500.00 |
| 2 | $47.50 | 10.5263 | 20.5263 | $1,000.00 | $975.00 |
| 3 | $45.00 | 11.1111 | 31.6374 | $1,500.00 | $1,423.68 |
| 4 | $42.00 | 11.9048 | 43.5422 | $2,000.00 | $1,828.77 |
| 5 | $40.00 | 12.5000 | 56.0422 | $2,500.00 | $2,241.69 |
| 6 | $43.00 | 11.6279 | 67.6701 | $3,000.00 | $2,909.81 |
| 7 | $46.00 | 10.8696 | 78.5397 | $3,500.00 | $3,612.82 |
| 8 | $44.00 | 11.3636 | 89.9033 | $4,000.00 | $3,955.75 |
| 9 | $48.00 | 10.4167 | 100.3200 | $4,500.00 | $4,815.36 |
| 10 | $51.00 | 9.8039 | 110.1239 | $5,000.00 | $5,616.32 |
| 11 | $53.00 | 9.4340 | 119.5578 | $5,500.00 | $6,336.57 |
| 12 | $55.00 | 9.0909 | 128.6488 | $6,000.00 | $7,075.68 |
The result. The investor holds 128.6488 units for $6,000, an average cost of $46.64 per unit ($6,000 divided by 128.6488). The simple average of the 12 prices is $47.04. The fixed amount bought 12.5000 units at the $40 low and only 9.0909 at the $55 high, which is what pulls the average cost below the average price. At the final $55 price the units are worth $7,075.68, a gain of $1,075.68.
Compared with buying a fixed number of units. If the same investor had bought 10 units every month instead, the average cost would equal the average price, $47.04, because every price gets the same weight. Fixed dollars always give an average cost at or below the average price; it is a property of the arithmetic (a harmonic mean is never above an arithmetic mean), not a prediction.
Notice the dip in value. In months 2 to 6 and again in month 8, the units were worth less than the money put in. DCA does not prevent losses along the way. What it does is keep buying through them, which is why the investor is ahead once prices recover. Enter these purchases in the calculator above to check the averages yourself.
3. Dollar Cost Averaging vs Lump Sum: Four Hypothetical Markets
The test. Two investors each have $12,000. One invests it all in month 1. The other invests $1,000 at the start of each month for 12 months, with the waiting money in cash earning nothing. We value both at the price at the end of month 12 in four invented markets. The last column shows the DCA result if the waiting cash had earned a hypothetical 3% a year instead.
| Hypothetical market | Price path | Lump sum | DCA, cash at 0% | DCA average cost | DCA, cash at 3% |
|---|---|---|---|---|---|
| Steady rise | $50 rising $1 a month to $62 | $14,880.00 | $13,457.63 | $55.28 | $13,625.82 |
| Fall, then recovery | $50 down to $33, back to $52 | $12,480.00 | $15,289.05 | $40.81 | $15,457.24 |
| Slow fall | $50 down to $38 | $9,120.00 | $10,501.02 | $43.42 | $10,669.21 |
| Up and down around $50 | Alternating $45 and $55, ending at $50 | $12,000.00 | $12,212.12 | $49.13 | $12,380.31 |
When the lump sum wins. In the steady rise, the lump sum ends $1,422.37 ahead, because all $12,000 was invested at the lowest price of the year. Every later DCA purchase paid more. Even with the waiting cash earning 3%, DCA trails by $1,254.18.
When DCA wins. If prices fall first, DCA wins: by $2,809.05 when the market recovers, and by $1,381.02 in the slow fall. In the choppy market, DCA ends $212.12 ahead because buying the $45 months more heavily than the $55 months lowered its average cost to $49.13.
Which is more likely? No one knows the next year’s path. What can be said is that whenever expected returns are positive, as all three hypothetical rates on this page assume, money invested sooner has more time to grow, so the lump sum has the edge on average. DCA’s benefit is protection against the worst case: investing everything at a peak. Our guide to investing $100,000 runs the same comparison for a larger sum, and investing $10,000 for a smaller one.
The cash-interest effect. Waiting money earning a hypothetical 3% added $168.19 to every DCA result. That narrows but does not close the gap in a rising market. If you stage a lump sum, keep the waiting cash in an insured savings account rather than idle in a brokerage account.
4. What DCA Does and Does Not Do
What it does. It removes the need to decide when to buy. It lowers the average cost per unit relative to the average price over the period. It spreads purchases so that no single bad day sets your whole cost. And it fits how most people earn money: a little at a time.
It does not guarantee a profit. In the slow-fall market in section 3, DCA lost less than the lump sum but still turned $12,000 into $10,501.02, a loss of $1,498.98. If the investment keeps falling, buying more of it on a schedule means losing more money. DCA manages timing risk, not the risk of owning the investment.
It does not raise the expected return. The lower average cost is measured against the average price during the period, not against the result of investing earlier. When markets rise over time, money held back to be averaged in later has less time invested. That is the cost you pay for smoother entry.
It does not replace a sound investment choice. DCA works best with diversified funds that are likely to be worth more in many years. Averaging into a single stock or a narrow sector can concentrate risk. Our guide to asset allocation explains how a mix of stocks, bonds and cash spreads risk, and all-in-one ETFs describes funds that hold a set mix.
It does not work if you stop. The benefit in the fall-and-recovery market came from buying at $33 to $38. An investor who paused the plan during the fall would have missed those units. A schedule only helps if it runs through the uncomfortable months.
Averaging down is different. DCA buys the same amount whatever the price. Averaging down means buying more only after a price falls, to lower the average cost of a position you already hold. The stock average calculator above shows how many shares that takes, and whether a target average is possible at the current price.
Check what a regular purchase costs at the broker you use, then compare with the $0-commission options.
5. Automatic Contributions and Pre-Authorized Purchases
Two kinds of automation. A recurring deposit moves money from your bank to your investment account on a schedule. A recurring purchase also buys the investment for you. With only the first, cash lands in the account and waits for you to place a trade. Check which one your platform offers before you rely on it.
| Platform | What is published |
|---|---|
| Wealthsimple (self-directed) | Recurring investments daily, weekly, every two weeks or monthly, in stocks, ETFs and crypto; fractional shares from $1; $0 stock and ETF commissions |
| Wealthsimple Managed Investing | Rebalances automatically based on deposits, withdrawals or goal changes; dividends reinvested into underweight ETFs |
| RBC InvestEase | Money is invested once the balance reaches $100; a balance of at least $100 but under $1,500 goes into a Starter Portfolio |
| TD Direct Investing | Accounts under $15,000 avoid the $25 quarterly fee with a systematic or pre-authorized contribution of at least $100 a month |
| RBC Direct Investing (GoSmart) | Offer for a first GoSmart account opened November 3, 2026 to January 11, 2027: 3,000 Avion points for recurring investments totalling $300 or more within the first 6 months, plus 4,500 points for $1,500 or more of qualifying net contributions by February 11, 2027 |
Robo-advisors. A robo-advisor invests your deposits into its portfolio for you, so scheduled deposits become scheduled purchases without any trades on your part; Wealthsimple Managed Investing, for example, rebalances on each deposit. The cost is the management fee on top of fund costs. On a $50,000 balance, total yearly cost at the five robo-advisors we rank runs from 0.37% to 1.05%. Our guide to how robo-advisors work and best robo-advisors ranking compare them.
Self-directed brokers without automatic buying. At a broker that does not publish recurring purchases, you can still automate the deposit from your bank and place one trade each month. Set a calendar reminder for the day after the deposit arrives. An all-in-one ETF makes this a single order: see how to buy ETFs.
Dividend reinvestment. A DRIP is DCA on a small scale: each dividend buys more units on the payment date. The published rules differ. Wealthsimple sets reinvestment per account, CIBC Investor’s Edge charges no fee to reinvest cash dividends, BMO InvestorLine buys DRIP units without commission, and Scotia iTRADE reinvests in whole shares only. Our best brokers for dividend investing lists who offers it.
Group plans. A workplace group RRSP with payroll deductions is DCA with an employer match on top. If your employer matches contributions, many people treat the match as the first place for regular savings, since it adds money that would otherwise be left on the table. Our group RRSP guide explains how matching works.
6. Fractional Shares and Whole Shares
Why it matters for DCA. A fixed dollar amount rarely buys a whole number of units. With fractional shares, every dollar is invested on the purchase date. With whole shares only, the remainder waits as cash until the next purchase, and a high unit price can mean buying only every second or third month.
| Method | Units held after 12 months | Amount invested | Cash left over | Value at $55 |
|---|---|---|---|---|
| Fractional units | 128.6488 | $6,000.00 | $0.00 | $7,075.68 |
| Whole shares, leftover carried to the next month | 128 | $5,967.00 | $33.00 | $7,073.00 |
A small gap at this size. With $500 a month and a $40 to $55 unit price, whole shares cost only $2.68 by the end of the year, because the leftover rolls into the next purchase. The gap grows when the amount is small next to the price: $100 a month into a unit priced at $150 buys a whole unit only in two of every three months.
| Broker | Fractional shares as published |
|---|---|
| Questrade | Eligible Canadian and US stocks and ETFs, commission-free, in real time |
| Interactive Brokers Canada | TSX and Cboe Canada stocks and ETFs plus US stocks; fractional trades follow the whole-share commission schedule |
| Wealthsimple | Thousands of Canadian and US stocks and ETFs, from $1, real time during market hours, commission-free |
| CIBC Investor’s Edge | Stocks and ETFs with a minimum of $1 and 0.00001 share, regular market hours only; online fractional trades commission-free September 15, 2026 to October 31, 2027 |
| TD Direct Investing and TD Easy Trade | Partial-share orders $1.99; TD Easy Trade dollar-amount orders from $1; TD Easy Trade’s first 100 trades a year cost $0, then $9.99 a trade |
Things to know. Fractional holdings can be awkward to move: Wealthsimple’s transfer rules exclude fractional shares from transfers into its self-directed accounts, so check the receiving firm’s policy before you switch. Partial shares pay partial dividends at TD Easy Trade. Our best brokers for fractional shares ranks the brokers that offer them by our overall score.
7. Commission Effects at Each Broker’s Published Rates
Small purchases magnify commissions. A $9.99 commission is 0.05% of a $20,000 trade but 2.0% of a $500 purchase. DCA means many small purchases, so a per-trade commission takes a bigger share of every dollar than it would on a single large trade.
| Broker | Cost per $500 purchase | Share of each purchase | Cost for 12 purchases | Average cost per unit with costs |
|---|---|---|---|---|
| Questrade, National Bank Direct Brokerage, Disnat, Wealthsimple, BMO InvestorLine, Qtrade | $0 | 0% | $0 | $46.64 |
| Webull Canada ($0 commission, $0.70 a month account fee) | $0.70 a month | 0.14% | $8.40 | $46.70 |
| Interactive Brokers Canada (CAD 0.01 a share, minimum CAD 1) | $1.00 | 0.20% | $12.00 | $46.73 |
| moomoo Canada (CA$0.0149 a share, minimum CA$1.49) | $1.49 | 0.30% | $17.88 | $46.78 |
| CIBC Investor’s Edge | $6.95 | 1.39% | $83.40 | $47.29 |
| RBC Direct Investing | $9.95 | 1.99% | $119.40 | $47.57 |
| TD Direct Investing | $9.99 | 2.00% | $119.88 | $47.57 |
| Scotia iTRADE | $9.99 | 2.00% | $119.88 | $47.57 |
How the last column is worked out. Costs are added to the $6,000 paid for the same 128.6488 units, then divided by the units, as the stock average calculator does when you enter commissions. At $9.99 a purchase, the average cost rises from $46.64 to $47.57, above the $47.04 average price, so commissions wipe out the whole averaging effect in this example.
Ways around commissions at bank brokers. Several bank-owned brokers waive commissions on some purchases: TD Direct Investing on select ETFs placed online, TD Easy Trade on the first 100 trades a year (then $9.99), RBC Direct Investing on a selection of more than 50 ETFs and on 50 GoSmart trades a year, CIBC Investor’s Edge on more than 200 ETFs, and Scotia iTRADE on more than 200 eligible ETFs (charged if sold within one business day). Check the list before you set up a plan.
Buying less often. At $9.99, buying $1,500 once a quarter costs 0.67% a purchase instead of 2.0%. In our hypothetical prices, though, after paying $9.99 each time, quarterly buying in months 3, 6, 9 and 12 ended with 125.8957 units against 126.0784 for monthly buying, because it missed the $40 low. Fewer purchases save commissions but average over fewer prices. Our best commission-free brokers page and the investment fee calculator help you weigh it.
8. Choosing the Amount and How Often
Match your pay. The easiest schedule follows your pay: a transfer the day after each paycheque, weekly, every two weeks or monthly. Money then moves before it can be spent. At a $0-commission broker the frequency makes little difference to cost; at a per-trade broker, fewer and larger purchases cost less.
| Account and 2026 limit | Monthly (12 deposits) | Every two weeks (26 deposits) |
|---|---|---|
| TFSA, $7,000 | $583.33 | $269.23 |
| FHSA, $8,000 | $666.67 | $307.69 |
| RRSP, $33,810 dollar limit | $2,817.50 | $1,300.38 |
Reading the limits. The TFSA and FHSA amounts are yearly limits for 2026; your own room may be higher if you have unused room carried forward. The RRSP figure is the 2026 dollar maximum; your personal limit is 18% of 2025 earned income up to that maximum, less any pension adjustment, plus unused room. Please check your notice of assessment before you set the amount.
Start small if you need to. Any regular amount is better than waiting for a large one. Many platforms accept small amounts: Wealthsimple’s fractional shares start at $1, and RBC InvestEase invests once the balance reaches $100. Increase the amount each time your pay rises.
Keep the date fixed. Choose a date and do not move it to chase a lower price. The point of DCA is that the date is chosen in advance. Moving it each month turns the plan back into market timing.
9. DCA in a TFSA, RRSP or FHSA
Contributions count when they land. Room is used the moment money reaches a registered account, invested or not. Park a lump sum in a TFSA and buy over six months, and the whole deposit has still used room on day one. Go over your TFSA room and the CRA charges 1% for every month the largest excess remains, with no grace amount.
RRSP timing. A monthly RRSP plan spreads both the purchases and the room used across the year. Under the 60-day rule, deposits made in January and February 2027, up to March 1, can go on your 2026 return (the CRA usually confirms the date each January), or you can leave them undeducted and claim them in a later year. See RRSP deadline 2027 and our RRSP guide.
FHSA timing. FHSA room starts only when you open the account, at $8,000 a year. If you plan to DCA into an FHSA, open it first, even with a small amount, so the room exists. Our FHSA guide covers the rules.
Taxable accounts and cost base. In a non-registered account each purchase adds to your adjusted cost base, which sets your capital gain or loss when you sell. Commissions are part of the cost. If you have not sold any units, the “average cost with commissions” from the stock average calculator above is your ACB per unit. Reinvested distributions also add to it. Our ACB calculator keeps a running record, and adjusted cost base explained covers the rules.
Which account first. For most savers, regular contributions go into registered room before a taxable account, so that growth is sheltered. Our which account to fill first guide and the TFSA vs RRSP comparison explain how people choose.
10. How Regular Contributions Grow
The long view. Over decades, the amount you contribute and how long it stays invested matter more than the average cost of any one year’s purchases. Here is $500 a month left to compound for 10, 20 and 30 years under each of the three hypothetical rates set out at the top of this page.
| Years | Total contributed | 3% a year | 5% a year | 7% a year |
|---|---|---|---|---|
| 10 | $60,000 | $69,871 | $77,641 | $86,542 |
| 20 | $120,000 | $164,151 | $205,517 | $260,463 |
| 30 | $180,000 | $291,368 | $416,129 | $609,985 |
Try your own plan in the compound interest calculator below: it takes a starting balance, a monthly amount, a yearly rate and a number of years, then lists the value at each year end.
The cost of starting a year later. Contributing for 19 years instead of 20 leaves less at the end by $10,749 at 3%, $15,843 at 5% and $23,338 at 7%. Waiting for a better entry point has a cost even when prices do eventually dip.
Growth share. At 5% over 30 years, $236,129 of the $416,129 is growth, about 57%. At 7% it is $429,985 of $609,985, about 70%. The later years do most of the work, which is why a schedule that keeps running matters more than any single purchase date.
11. Behaviour: Why a Schedule Helps
It takes the decision away. Deciding when to invest invites second-guessing. A fixed schedule makes the decision once. You then only decide whether to keep the plan, which most people find easier than judging markets each month.
It turns falls into lower prices. When prices drop, a DCA investor buys more units for the same money. Thinking of a fall as a lower purchase price, rather than a loss on paper, makes it easier to keep going. The fall-and-recovery market in section 3 shows how much those cheaper units can be worth.
It limits regret. Investing a large sum the week before a fall is painful, and the fear of it keeps some people in cash for years. Spreading the purchase caps that regret. If the fear would otherwise stop you investing at all, DCA is likely the better of the two outcomes for you.
Check less often. Looking at the balance daily makes normal ups and downs feel larger. Checking monthly or quarterly, with a fuller review once a year, keeps attention on the plan rather than the day’s price. Rebalancing on a set rule, as our asset allocation guide explains, keeps the mix on target without daily attention.
Keep the emergency fund separate. A plan that has to be stopped whenever a bill arrives will be stopped at the worst moment. Keeping an emergency fund in an insured savings account protects the plan. Our emergency fund calculator sets a target.
12. Spreading a Lump Sum on Purpose
When people choose it. Someone who receives a bonus, a home sale or an inheritance may choose DCA for part or all of it. It is a reasonable choice when the main risk is not following through: investing in parts is better than leaving the money in cash because of nerves.
Set the rules first. Decide the period (for example 3, 6 or 12 months), the amount per purchase and the dates, and write them down. A $24,000 sum over six months is $4,000 a month on the first business day. Automate it if your platform allows, so a bad week does not pause it.
Where the waiting money goes. Keep the unspent part in a high-interest savings account at a CDIC member, or in the cash or savings option of the same registered account you will invest from. In section 3, a hypothetical 3% on waiting cash added $168.19 over a year on $12,000.
Mixing the two. Some investors put a share in at once and spread the rest. The share invested at once captures more of the growth if prices rise; the staged share cushions an early fall. There is no single correct split.
Large sums and tiers. If the sum is large, the order of accounts, fees and deposit insurance matter more than the schedule. Our guide to how to invest $100,000 covers those steps.
13. DCA Mistakes to Avoid in Canada
Paying a commission on every small purchase. At $9.99 a trade, $500 a month loses 2.0% to commissions before it is invested, enough to cancel the averaging effect in our example. Use a $0-commission broker or a broker’s commission-free ETF list, or buy less often.
Stopping during a fall. The cheapest units are bought when prices are down. Pausing then removes the benefit DCA is meant to deliver.
Averaging into one stock. DCA cannot rescue a poor investment. Regular purchases of a single company concentrate risk, especially if its price is falling for a reason.
Over-contributing. Automated deposits keep running until you stop them. If your TFSA, FHSA or RRSP room runs out mid-year, the excess is taxed at 1% a month (after a $2,000 cushion for the RRSP). Recheck room each January.
Letting cash pile up. A recurring deposit without a recurring purchase can leave months of cash uninvested. Check that the money is being invested, not just deposited.
Confusing DCA with a guarantee. A lower average cost than the average price is not a profit. If the final price is below your average cost, you have a loss.
What You Need and What You Get
What you need to start dollar-cost averaging
- A fixed amount you can invest every period without touching your emergency fund
- A schedule tied to your pay: weekly, every two weeks or monthly
- An account with room: TFSA, RRSP, FHSA or a taxable account
- A diversified investment you plan to hold for years
- A platform with $0 commissions, a commission-free ETF list or recurring purchases
- Fractional shares, if your amount is small next to the unit price
- A linked bank account for automatic deposits
- A yearly reminder to check room, costs and the plan
What you get from a dollar-cost averaging plan
- An average cost per unit at or below the average price you paid
- No need to judge when to buy
- Less regret if prices fall soon after you start
- More units bought automatically when prices are low
- A savings habit that runs without effort
- Low costs at $0-commission brokers, even for small amounts
- Steady use of TFSA, RRSP and FHSA room through the year
- Clear records of each purchase for your cost base
How to Set Up Dollar-Cost Averaging, Step by Step
- Set the amount. Choose an amount you can keep investing through a job change or a market fall. The limits table in section 8 shows what fills each account.
- Pick the account. Use registered room first in most cases, and open an FHSA before you plan to fund it.
- Pick the platform. Prefer $0 commissions or a commission-free ETF list, and fractional shares if your amount is small. Our guide to opening a brokerage account covers the set-up.
- Choose what to buy. A diversified fund keeps one purchase simple. This page does not recommend any fund; see our ETF and asset allocation guides for how fund types differ.
- Automate it. Schedule the deposit the day after payday and, where available, a recurring purchase. Otherwise set a monthly reminder to place the order.
- Record each purchase. In a taxable account, keep the date, units, price and commission. The stock average and ACB calculators do the arithmetic.
- Review once a year. Recheck room each January, raise the amount when your pay rises and rebalance if your mix has drifted.
10 Strategies for Dollar-Cost Averaging
1. Invest the day after payday
Money that moves before you see it in chequing is not spent. A transfer timed to payday turns saving into the default instead of a monthly decision.
2. Use a $0-commission platform for small amounts
At $9.99 a trade, $500 purchases lose 2.0% each time. Seven brokers charge $0 on online Canadian trades, and several bank brokers waive commissions on lists of ETFs.
3. Choose fractional shares when the price is high
If one unit costs more than a third of your monthly amount, fractional shares keep every dollar invested on the purchase date instead of waiting as cash.
4. Keep buying through falls
The cheaper units bought during a decline do the most work when prices recover. Decide in advance that a fall is a reason to keep the plan, not to pause it.
5. Raise the amount with each raise
Adding part of every pay increase to the plan grows contributions without cutting your spending. Over 20 years at a hypothetical 5%, each extra $100 a month adds about $41,103.
6. Fill the TFSA evenly
$583.33 a month uses the $7,000 TFSA limit for 2026 exactly. If you have carried-forward room, a larger amount can use more of it through the year.
7. Reinvest distributions
Turning on DRIP where it is free reinvests dividends automatically, adding small, regular purchases on top of your own.
8. Stage a windfall with fixed dates
If you spread a lump sum, set the period and dates in writing and keep waiting cash insured. Without fixed dates, staging can drift into waiting for a dip.
9. Keep an emergency fund outside the plan
A separate cash reserve means you never have to sell or pause the plan to pay an unexpected bill.
10. Track the average cost, not the daily price
Check your average cost and total contributions once a quarter. The stock average calculator shows whether commissions are eating into the averaging effect.
Illustrative Example: Two Savers, Two Brokers
This example is hypothetical. Ava and Ben each invest $500 on the first trading day of every month for 12 months in the same fund, at the unit prices in section 2 ($50 down to $40 and up to $55). Ava uses a $0-commission broker with fractional shares. Ben uses a broker that charges $9.99 a trade and buys whole shares only, carrying any leftover cash to the next month after paying the commission.
- Ava’s purchases. Each $500 buys $500 divided by that month’s price. After 12 months she holds 128.6488 units for $6,000, an average cost of $46.64, with $0 in commissions.
- Ben’s purchases. Each month Ben pays $9.99 and buys as many whole shares as the rest of his cash allows. He ends with 126 shares that cost $5,876.50, plus $119.88 in commissions (12 x $9.99) and $3.62 of cash left over.
- Ben’s average cost. Without commissions, his average price is $46.64 ($5,876.50 / 126). With commissions it is $47.59 (($5,876.50 + $119.88) / 126), above the $47.04 average price.
- Value at the end. At the final $55 price, Ava’s units are worth $7,075.68. Ben’s shares are worth $6,930.00 plus $3.62 cash, $6,933.62 in all, which is $142.06 less.
- Over 20 years. If Ben kept paying $9.99 a month for 20 years, he would pay $2,397.60 in commissions. Had that $9.99 been invested each month at the hypothetical 5% rate instead, it would have grown to $4,106.23.
The difference comes almost entirely from commissions, not from whole shares: in section 6, whole shares alone cost only $2.68 over the same year. The figures use the same formulas as the stock average and compound interest calculators on this page.
Dollar-Cost Averaging FAQ
What is dollar cost averaging?
Dollar-cost averaging is investing a fixed dollar amount on a regular schedule, such as $500 a month, whatever the price. The fixed amount buys more units when prices are low and fewer when they are high, so the average cost per unit ends up at or below the average price paid. In Canada it is often done through automatic contributions to a TFSA, RRSP or robo-advisor account.
Does dollar cost averaging work?
It does what it promises: it lowers your average cost relative to the average price and removes the need to time purchases. It does not guarantee a profit. In our hypothetical slow-falling market, $12,000 invested at $1,000 a month was worth $10,501.02 after a year. It also tends to trail a lump sum when prices rise, because money waiting to be invested has less time to grow.
Is dollar cost averaging better than investing a lump sum?
Not on average when returns are positive, because a lump sum is invested sooner. In our hypothetical steady rise, a $12,000 lump sum ended $1,422.37 ahead of $1,000 a month. If prices fall first, DCA wins: it ended $2,809.05 ahead in our fall-and-recovery market. DCA suits people who would otherwise stay in cash or would regret investing just before a fall.
How often should I dollar cost average?
Most people match their pay: weekly, every two weeks or monthly. At a $0-commission broker the frequency barely affects cost, so following your paycheque is simplest. At a broker charging $9.99 a trade, $500 monthly purchases lose 2.0% each time, while $1,500 quarterly purchases lose 0.67%. Whatever you choose, keep the dates fixed rather than moving them to chase prices.
Can I dollar cost average in a TFSA?
Yes. Regular TFSA contributions are one of the most common ways Canadians use dollar-cost averaging. To use the full 2026 limit of $7,000 in equal parts, invest $583.33 a month or $269.23 every two weeks. Each deposit uses room the day it lands, and excess contributions are taxed at 1% a month, so please check your room before automating.
Which Canadian platforms offer automatic investing?
Wealthsimple publishes recurring investments daily, weekly, every two weeks or monthly in stocks, ETFs and crypto. Robo-advisors invest deposits automatically; RBC InvestEase starts investing once your balance reaches $100. TD Direct Investing drops its $25 quarterly small-account fee for clients with a pre-authorized contribution of at least $100 a month. At brokers without recurring purchases, you can automate the deposit and place a trade yourself.
Do commissions matter for dollar cost averaging?
Yes, because DCA means many small purchases. Twelve $500 purchases cost $0 in commissions at seven brokers (Webull adds $8.40 a year in account fees), $12.00 at Interactive Brokers, $83.40 at CIBC Investor’s Edge and $119.88 at TD Direct Investing or Scotia iTRADE. In our 12-month example, $9.99 commissions raised the average cost from $46.64 to $47.57, above the $47.04 average price, cancelling the averaging effect.
Do I need fractional shares to dollar cost average?
Not always, but they help when your amount is small next to the price. In our example, whole shares with leftover cash carried forward ended only $2.68 behind fractional units over a year. With $100 a month and a $150 unit price, whole shares buy only two months in three. Wealthsimple, Questrade, Interactive Brokers, CIBC Investor’s Edge and TD offer fractional or partial shares.
What is the difference between dollar cost averaging and averaging down?
Dollar-cost averaging invests the same amount on a schedule, whatever the price. Averaging down means buying extra only after a price has fallen, to lower the average cost of a position you already hold. Averaging down concentrates money in an investment that has dropped, which adds risk if it keeps falling. The stock average calculator on this page shows the shares an averaging-down purchase would take.
Should I dollar cost average an inheritance or bonus?
You can. Spreading a lump sum over a set period lowers the regret of investing just before a fall, at the cost of lower expected growth when prices rise. Set the period and dates in writing, automate them, and keep the waiting cash in an insured savings account. In our examples, waiting cash at a hypothetical 3% added $168.19 over a year on $12,000.
How do I calculate my average cost per share?
Add up what you paid for every purchase and divide by the total units you hold. In our example, $6,000 divided by 128.6488 units is $46.64. Add commissions to the total paid to get the average cost with commissions, which is your adjusted cost base per unit in a taxable account if you have not sold any. The stock average calculator on this page does it for you.
Does dollar cost averaging protect against losses?
No. It spreads your entry price, but if the investment ends below your average cost you still have a loss. In our hypothetical slow fall from $50 to $38, DCA lost $1,498.98 on $12,000, less than the $2,880.00 lost by investing it all in month one. DCA manages timing risk; diversification and an asset mix you can hold manage the risk of the investment itself.
Put a schedule in place: open the account, automate the deposit and keep commissions at or near $0.
Every price path and return on this page is a labelled hypothetical, and every commission comes from the broker’s published pricing as recorded in our broker data. Our editorial standards explain how we build and label worked examples.
Figures on this page were checked against each provider’s published pricing and Canada Revenue Agency publications on November 9, 2026. We update this page when a figure changes.
Meet the Experts Behind WealthScale

Sharad is a CPA Ontario member (No. 61040184) and a Certified Public Accountant licensed in Washington and Montana, with more than 15 years in accounting and tax, a Diploma in Banking and Finance and a Certificate in Small Business Finance. He checks WealthScale content against primary sources. WealthScale is independent of his firm, Gondaliya CPA Professional Corporation, and provides general information only, not personal financial, investment, tax or legal advice.
- Chartered Professional Accountant, CPA Ontario
- Certified Public Accountant, Washington (No. 57629) and Montana (No. PAC-CPAP-LIC-033176)
- Writing on tax and registered accounts since 2021
- Reader’s Choice Award 2025 Winner, Best Accountant (Toronto)
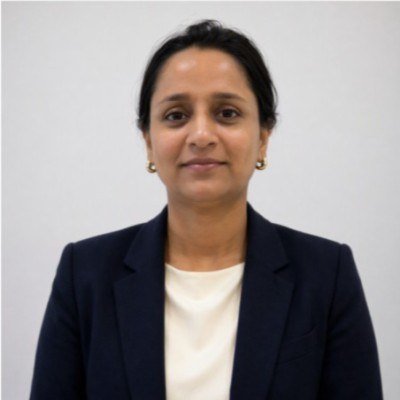
Neha Gupta is a CFA charterholder based in Winnipeg who has worked in financial markets since December 2005. She has published more than 2,600 investment articles and is Head of Operations and Finance at Whiteland Real Estate. She reviews WealthScale’s investing pages for accuracy.
- CFA charter, CFA Institute (awarded 2023)
- Post Graduate Diploma in Business Administration (Finance), 2008
- In financial markets since December 2005
- More than 2,600 published investment articles
General information only. Not financial, investment, tax or legal advice. WealthScale is independent and is published by WealthScale Media Inc., 55 Queen St E, Suite 1205, Toronto, ON M5C 1R6. CFA® and Chartered Financial Analyst® are registered trademarks owned by CFA Institute.