

Safe Withdrawal Rate in Canada: Is 4% Still Right?
The safe withdrawal rate Canada retirees hear about most is 4%: in the first year of retirement you withdraw 4% of your savings, then you take the same dollar amount, raised with inflation, each year after. On $1,000,000 that is $40,000 a year. Our calculations show it lasts 34.0 years if the portfolio earns 2% a year after inflation, 28.6 years at 1% and 25.0 years at 0%. So 4% is a reasonable start for a 30-year retirement, but too high for 40 years at low returns. CPP and OAS, RRIF minimums, taxes and fees all change the answer for Canadians, and this page works through each one.
 Written by Sharad Gondaliya, CPA CPAChartered Professional Accountant, CPA Ontario No. 61040184
 Financial reviewer: Neha Gupta, CFA CFA charterholderReview of this page scheduled
At a glance
What a safe withdrawal rate is. It is the share of your savings you take in the first year of retirement, with that dollar amount raised by inflation every year after, so your spending keeps pace with prices. It is measured against the portfolio on the day you retire, not each year’s balance.
Where 4% came from. The 4% rule is a rule of thumb from US research that tested past US stock and bond returns over 30-year retirements. Starting withdrawals of about 4% held up in the periods tested. It describes the past in one country; it is not a promise about future returns in Canada.
How long 4% lasts. In our tables, a 4% withdrawal lasts 25.0 years at a 0% return after inflation, 34.0 years at 2% and 83.1 years at 4%. To last exactly 30 years, the level withdrawal is 3.33% at a 0% real return, 4.38% at 2% and 5.56% at 4%.
Sequence of returns risk. The order of returns can matter as much as the average. With the same ten returns averaging 4%, $45,000 a year from $1,000,000 lasts 39.2 years if the bad years come first and 53.7 years if they come last.
Canada’s floor. CPP and OAS reduce what your savings must pay. With the average new CPP at 65 ($858.34 a month in July 2026) and a full OAS ($762.50 a month for October to December 2026), $19,450.08 a year comes before you touch savings.
Canadian rules that move the rate. RRIF minimums are 5.28% at 71 and 6.82% at 80, so you may have to withdraw more than you spend. Tax means a RRIF must pay more than you spend: $40,000 of extra after-tax spending took a $51,584 withdrawal for our Ontario retiree.
Start with your own numbers. Enter your portfolio, a yearly withdrawal as a dollar amount or a percentage, and a return after inflation. The calculator reports how many years the money lasts, what is left after a period you pick, the outcome at 3% to 6%, and the effect of bad years coming first.
1. The Short Answer: Is 4% a Safe Withdrawal Rate in Canada?
The decision rule. A safe withdrawal rate depends on three things: how long the money must last, the return your portfolio earns after inflation and fees, and how flexible your spending is. Choose the length first, then the return you are willing to assume, then read the rate from the table below. If you can cut spending after bad years, you can start a little higher; if you cannot, start lower.
For a 30-year retirement. 4% works if your portfolio earns at least about 2% a year after inflation and fees: the level withdrawal that lasts exactly 30 years at 2% is 4.38%. At a 1% real return, it is 3.84%, and at 0% it is 3.33%. Someone retiring at 65 and planning to 95 is in this row.
For 35 to 40 years. A retiree at 55, or a couple where one spouse may live past 95, needs the money to last longer. At a 2% real return, the rate that lasts exactly 40 years is 3.58%, and at 1% it is 3.02%. For these retirees, 4% is a stretch unless returns are strong or spending can bend.
For 20 to 25 years. A later retiree, or anyone planning a shorter horizon, can take more: 5.02% lasts exactly 25 years at a 2% real return, and 6.00% lasts 20 years.
| Years the money must last | 0% real return | 1% real return | 2% real return | 3% real return | 4% real return |
|---|---|---|---|---|---|
| 20 years | 5.00% | 5.49% | 6.00% | 6.53% | 7.08% |
| 25 years | 4.00% | 4.50% | 5.02% | 5.58% | 6.15% |
| 30 years | 3.33% | 3.84% | 4.38% | 4.95% | 5.56% |
| 35 years | 2.86% | 3.37% | 3.92% | 4.52% | 5.15% |
| 40 years | 2.50% | 3.02% | 3.58% | 4.20% | 4.86% |
Why these are not guarantees. The table assumes the same return every year. Real returns arrive in an uneven order, and section 5 shows how a few bad years at the start can cut years off the result. Treat each rate as the most you could take if returns were steady, then leave a margin.
2. 2026 Figures That Change Your Withdrawal Rate
Why Canadian figures matter. A withdrawal rate tells you what your savings can pay. Your retirement income is that plus CPP, OAS and any pension, minus tax. The figures below set the size of that floor, the minimum you must take from a RRIF and the tax on what you take.
| Item | Figure | Applies to |
|---|---|---|
| CPP maximum at 65 | $1,507.65 a month ($18,091.80 over 12 months) | Pension starting January 2026 |
| CPP average at 65 | $858.34 a month ($10,300.08 over 12 months) | New pensions, July 2026 |
| CPP start age change | 0.6% less a month before 65 (36% at 60); 0.7% more a month after 65 (42% at 70) | Any start age from 60 to 70 |
| OAS maximum | $762.50 a month at ages 65 to 74 ($9,150 over 12 months); $838.75 at 75 and over | October to December 2026 |
| OAS deferral increase | 0.6% a month, up to 36% at 70 | Starting after 65 |
| OAS recovery tax | 15% of net income above $95,323 | 2026 income year |
| GIS maximum, single | $1,138.90 a month; income must be below $23,112 | October to December 2026 |
| RRIF minimum factor | 5.28% at 71; 5.82% at 75; 6.82% at 80; 8.51% at 85; 11.92% at 90; 20.00% at 95 and over | Age on January 1 |
| Withholding on the RRIF minimum | None | Every province and territory |
| Withholding above the minimum or on an RRSP withdrawal | 10%, 20% or 30% by size outside Quebec | Amounts over $5,000 and $15,000 set the rate |
| TFSA dollar limit | $7,000 | 2026 |
| Federal age amount | $9,208, reduced above $46,432 of net income | 65 or older, 2026 |
| Federal pension income amount | Lesser of $2,000 and eligible pension income | RRIF payments from 65 |
The floor in dollars. For one person with the average new CPP and a full OAS at 65, the floor is $10,300.08 plus $9,150.00, or $19,450.08 a year. For a couple who both receive those amounts, it is $38,900.16. A household that wants $60,000 a year needs its savings to pay only the part above the floor, which changes the size of the portfolio a 4% rule calls for. Our CPP payment amounts and OAS payment amounts pages show the latest figures, and our guide to when to take CPP covers the start-age trade-off.
3. How the 4 Percent Rule Works in Canada and Where It Came From
The origin, in general terms. The 4% rule grew out of US retirement research that used past US stock and bond returns. Researchers tested a simple plan: take a fixed share of the portfolio in the first year, raise that dollar amount with inflation every year, and see whether the money lasted 30 years in each historical period. Starting withdrawals of about 4% lasted in the periods tested; higher starting rates ran out in some of them.
What the rule assumes. It assumes a 30-year retirement, a mix of stocks and bonds, spending that rises with inflation no matter what markets do, and returns like those of past US markets. Rules of thumb like this rarely include your own fees, your taxes, or Canadian rules such as RRIF minimums and the OAS recovery tax. Each of those is covered below.
How to use it. In year one, multiply your portfolio by your rate: 4% of $750,000 is $30,000. In later years, take the same $30,000 adjusted for inflation, which means raising it by the inflation rate each year. You do not recalculate 4% of each year’s balance; that would be a different plan, with spending that rises and falls with markets.
The rule of 25. Turned around, a 4% rate means you need 25 times the yearly amount your savings must pay. At 3.5%, it is 28.6 times, and at 3%, 33.3 times. If your savings must pay $40,000 a year, a 4% rate calls for $1,000,000 and a 3.5% rate for $1,142,857. The FIRE calculator below does this for any spending and rate, and shows how long it takes to save that amount. Our FIRE in Canada guide applies the same idea to early retirement.
What “safe” means. Safe means the money lasted in the past under the stated assumptions. It does not mean the money will last, and it does not mean the rate is right for you. A plan with a 4% start and no flexibility can still run short if returns are poor for a long time, inflation is high, or you live longer than planned. A plan with room to cut spending is safer at any rate.
Nominal and real returns. Every table on this page uses real returns, meaning returns after inflation, and keeps all amounts in 2026 dollars. A portfolio earning 5% when inflation is 3% has a real return of about 2%. If you use a nominal return with an inflation-adjusted withdrawal, you will overstate how long the money lasts.
4. Worked Numbers: How Long Savings Last at 3%, 4%, 5% and 6%
The assumptions. Each table starts with $1,000,000. The withdrawal comes out at the start of each year and the rest earns the real return shown for the year, the same method our withdrawal rate calculator uses. The results scale: $500,000 at the same rate lasts exactly as long. Tax, fees, CPP and OAS are left out here and added in later sections.
| Withdrawal rate (first-year amount) | 0% real | 1% real | 2% real | 3% real | 4% real | 5% real |
|---|---|---|---|---|---|---|
| 3% ($30,000) | 33.3 years | 40.3 years | 53.5 years | More than 100 years | Does not run out | Does not run out |
| 3.5% ($35,000) | 28.6 years | 33.4 years | 41.5 years | 60.4 years | Does not run out | Does not run out |
| 4% ($40,000) | 25.0 years | 28.6 years | 34.0 years | 44.1 years | 83.1 years | Does not run out |
| 4.5% ($45,000) | 22.2 years | 25.0 years | 28.9 years | 35.3 years | 49.2 years | Does not run out |
| 5% ($50,000) | 20.0 years | 22.2 years | 25.1 years | 29.6 years | 37.4 years | 62.4 years |
| 6% ($60,000) | 16.7 years | 18.1 years | 20.0 years | 22.5 years | 26.1 years | 32.4 years |
Reading the table. “Does not run out” means the return covers the withdrawal and the balance never falls. At 4% and a 2% real return, the money lasts 34.0 years: enough for a retiree at 65 to reach 99, but not for a 55-year-old to reach 95. At 6%, even a 4% real return runs out in 26.1 years.
| Withdrawal rate | Yearly withdrawal | 2% real return | 3% real return | 4% real return |
|---|---|---|---|---|
| 3% | $30,000 | $569,978 | $957,182 | $1,493,547 |
| 4% | $40,000 | $156,184 | $467,155 | $910,264 |
| 5% | $50,000 | $0 (runs out in year 26) | $0 (runs out in year 30) | $326,981 |
| 6% | $60,000 | $0 (runs out in year 20) | $0 (runs out in year 23) | $0 (runs out in year 27) |
What the balances add. A lower rate leaves money for later life, for long-term care, or for heirs. At a 3% real return, 3% leaves almost the whole $1,000,000 after 30 years, while 5% is gone in the 30th year. The choice between those is a choice between spending now and safety later.
How much can I withdraw in retirement with CPP and OAS?
Add the floor on top. What you can spend each year is your withdrawal plus CPP, OAS and any pension. The table takes one person with the average new CPP at 65 and a full OAS, $19,450.08 a year in total, and shows the yearly income before tax from three portfolio sizes at 3%, 4% and 5%.
| Savings at retirement | Income at a 3% withdrawal | Income at 4% | Income at 5% | Share of the 4% income paid by CPP and OAS |
|---|---|---|---|---|
| $300,000 | $28,450.08 | $31,450.08 | $34,450.08 | 61.8% |
| $600,000 | $37,450.08 | $43,450.08 | $49,450.08 | 44.8% |
| $900,000 | $46,450.08 | $55,450.08 | $64,450.08 | 35.1% |
What the floor is worth. On $600,000 at 4%, savings pay $24,000 and CPP and OAS add $19,450.08, so public pensions supply 44.8% of a $43,450.08 income. Drawing that income from the $600,000 alone would take a 7.24% withdrawal rate ($43,450.08 / $600,000), far above any rate in our tables. A couple who both receive these amounts has a $38,900.16 floor. Delaying CPP or OAS raises the floor for life. Use the retirement income calculator to add your own savings, CPP and OAS start ages and see your yearly income.
Check how your plan holds up if markets fall in your first years of retirement, then compare 3% to 6% side by side.
5. What Changes the Answer: Sequence of Returns Risk, Fees and Time
Sequence of returns risk
What it is. Sequence of returns risk is the danger that poor returns arrive early in retirement, while you are withdrawing. A loss in year one shrinks the portfolio just as you sell to pay the bills, so fewer dollars are left to recover when markets rise. The same losses ten years later do much less damage, because by then you have already taken a good part of what you need.
A worked example. Two retirees each start with $1,000,000 and take $45,000 a year (4.5%). Both earn the same ten returns, which average 4% a year after inflation, then 4% a year after that. One gets the three bad years first; the other gets them last. These are the same paths our withdrawal rate calculator uses.
| Year | Bad years first: return | Bad years first: balance | Bad years last: return | Bad years last: balance |
|---|---|---|---|---|
| 1 | −11% | $849,950 | +4% | $993,200 |
| 2 | −6% | $756,653 | +9% | $1,033,538 |
| 3 | −1% | $704,536 | +9% | $1,077,506 |
| 4 | +9% | $718,895 | +9% | $1,125,432 |
| 5 | +9% | $734,545 | +9% | $1,177,671 |
| 6 | +9% | $751,604 | +9% | $1,234,611 |
| 7 | +9% | $770,199 | +9% | $1,296,676 |
| 8 | +9% | $790,467 | −1% | $1,239,160 |
| 9 | +9% | $812,559 | −6% | $1,122,510 |
| 10 | +4% | $798,261 | −11% | $958,984 |
What the order costs. After ten years, with the same returns in a different order, one retiree has $160,723 more than the other. Over the long run the gap grows:
| Yearly withdrawal | Order of returns | Money lasts | Balance after 30 years |
|---|---|---|---|
| $45,000 (4.5%) | Steady 4% every year | 49.2 years | $618,622 |
| $45,000 (4.5%) | Bad years first | 39.2 years | $355,474 |
| $45,000 (4.5%) | Bad years last | 53.7 years | $707,638 |
| $50,000 (5%) | Steady 4% every year | 37.4 years | $326,981 |
| $50,000 (5%) | Bad years first | 30.9 years | $43,273 |
| $50,000 (5%) | Bad years last | 40.4 years | $434,566 |
Reading the result. At 4.5% with a 4% real return, the bad-first path lasts 39.2 years, 10 years less than steady returns but still long enough for most retirees at 65. At 5%, the bad-first path leaves only $43,273 after 30 years. Sequence risk matters most when the withdrawal rate is already close to the limit, which is why a margin below the table rates helps.
Fees
A fee is a lower return. Every percentage point of fees comes straight off your real return. The table takes $1,000,000, a $40,000 withdrawal and a 4% real return before fees, and shows the effect of yearly fees.
| Yearly fee | Return after fees | Money lasts | Balance after 30 years |
|---|---|---|---|
| 0% | 4.00% | 83.1 years | $910,264 |
| 0.25% | 3.75% | 63.6 years | $784,803 |
| 0.50% | 3.50% | 54.3 years | $669,615 |
| 1.00% | 3.00% | 44.1 years | $467,155 |
| 1.50% | 2.50% | 38.1 years | $297,557 |
| 2.00% | 2.00% | 34.0 years | $156,184 |
What the fee table shows. Moving from a 2% fee to a 0.25% fee adds $628,619 to the balance after 30 years in this example ($784,803 – $156,184). Our MER explained page shows how fund fees are charged, and the investment fee calculator works out the cost for your own balance.
Time, inflation, asset mix and flexibility
Time. The longer the retirement, the lower the rate: at a 2% real return, 4.38% lasts 30 years but only 3.58% lasts 40. Planning to an age you may outlive is one of the easiest ways for a plan to come up short.
Inflation. High inflation lowers real returns, and a withdrawal that keeps pace with inflation must rise faster. CPP and OAS are indexed to inflation, which protects the floor, while most private savings are not.
Asset mix. More stocks usually means a higher expected return and bigger swings, so more sequence risk. More bonds, GICs and cash usually means steadier but lower returns. A portfolio that is too cautious can fail slowly, by earning too little after inflation.
Flexibility. Retirees who can spend less after a bad year can start a little higher. Section 10 explains guardrail rules, and the example at the end of this page shows one at work.
6. Tax Effects: Your Portfolio Withdrawal Rate Before and After Tax
Gross or net. A withdrawal rate is a gross figure: what leaves the portfolio. Spending is a net figure: what is left after tax. From a TFSA, the two are the same. From an RRSP or RRIF, every dollar is taxable, so the gross withdrawal must be larger than what you spend.
An Ontario example. The table takes one person aged 65 in Ontario with the average new CPP ($10,300.08 a year) and a full OAS ($9,150) and adds RRIF withdrawals. Tax uses 2026 rules, including the federal age amount and pension income amount, and leaves out Ontario’s own age and pension credits.
| RRIF withdrawal | Net income | Income tax | OAS recovery | Income after tax |
|---|---|---|---|---|
| $0 | $19,450.08 | $52.57 | $0.00 | $19,397.51 |
| $20,000 | $39,450.08 | $3,436.90 | $0.00 | $36,013.18 |
| $45,000 | $64,450.08 | $9,545.96 | $0.00 | $54,904.12 |
| $51,583.72 | $71,033.80 | $11,636.29 | $0.00 | $59,397.51 |
| $60,000 | $79,450.08 | $14,458.46 | $0.00 | $64,991.62 |
The gross-up. To add $40,000 of after-tax spending to her CPP and OAS, this retiree must take $51,583.72 from her RRIF, because the withdrawal adds $11,583.72 of tax ($11,636.29 minus the $52.57 she pays with no withdrawal). On a $1,000,000 RRIF, that is a 5.16% withdrawal rate, not 4%. If the same $40,000 came from a TFSA, the rate would stay at 4.00%. Most retirees draw from a mix of accounts, so their gross rate falls in between.
RRIF minimums and the withdrawal rate
The minimum is not your spending. Starting the year after a RRIF is opened, at least the minimum must come out each year, worked out as the January 1 value times your age factor. The factor is 4% at 65 and keeps rising. The table compares the minimum on a $1,000,000 RRIF with a $40,000 spending plan.
| Age on January 1 | Minimum factor | Minimum on $1,000,000 | Above $40,000 by |
|---|---|---|---|
| 71 | 5.28% | $52,800 | $12,800 |
| 75 | 5.82% | $58,200 | $18,200 |
| 80 | 6.82% | $68,200 | $28,200 |
| 85 | 8.51% | $85,100 | $45,100 |
| 90 | 11.92% | $119,200 | $79,200 |
| 95 and over | 20.00% | $200,000 | $160,000 |
What to do with the extra. You must withdraw the minimum, but you do not have to spend it. After tax, the part you do not need can go into a TFSA (the 2026 limit is $7,000, plus unused room) or a non-registered account, where it keeps working for you. The withdrawal rate that matters for safety is what you spend from all accounts combined. Our RRIF minimum withdrawal table lists every factor, and the RRIF withdrawal strategy page covers timing.
The OAS line. OAS shrinks by 15 cents for each dollar of 2026 net income above $95,323. A large RRIF minimum, or a gross-up for tax, can push income over that line, which raises the gross withdrawal you need for the same spending. Drawing RRIF money earlier, and splitting it with a spouse from 65, keeps later minimums smaller. Our guide to the retirement withdrawal order works through this for an Ontario couple, and the RRIF withholding tax page covers tax taken at source.
7. Step-by-Step: Setting Your Safe Withdrawal Rate
A rate is a plan, not a number. The steps below turn a rule of thumb into a plan you can check each year.
- Decide how long the money must last: to 95 for most people retiring at 65, longer for early retirees or a younger spouse.
- Choose a real return after fees that you are willing to plan on, and test at least one lower one.
- Add up your floor: CPP, OAS and any pension from the ages you will start them.
- Subtract the floor from your yearly spending to find what your savings must pay.
- Gross up that amount for tax, based on which accounts it will come from.
- Read a starting rate from the tables, then leave a margin for sequence risk and surprises.
- Each January, compare this year’s withdrawal with your portfolio and adjust under the rules you set in advance.
What you need
- Balances of every RRSP, RRIF, TFSA, pension and non-registered account
- Your yearly spending, split into essential and flexible
- CPP estimate at your planned start age
- Years in Canada after 18, for OAS
- Your fund and account fees, as a yearly percentage
- Your spouse’s figures and ages
- Last year’s tax return, to estimate your tax rate
What you get
- A starting withdrawal in dollars, not just a percentage
- A clear view of how much CPP and OAS cover
- A gross withdrawal that allows for tax
- A margin against bad early years
- Rules for when to cut or raise spending
- A plan for RRIF minimums you do not spend
- A yearly check instead of guesswork
8. Special Situations
Couples. Two CPP pensions and two OAS pensions make a bigger floor, and pension splitting from 65 lowers the tax on RRIF withdrawals, so the gross-up is smaller. But the plan must also work for the survivor, who keeps one OAS, may receive a CPP survivor’s pension, and pays tax alone. Test your rate for the surviving spouse as well as for the couple.
Early retirees. Someone retiring at 50 may need 45 years or more. The level withdrawal that lasts exactly 45 years is 3.32% at a 2% real return and 2.74% at 1%; for 50 years, it is 3.12% and 2.53%. Early retirees also have no CPP or OAS for 10 to 15 years, so savings carry the whole load at first. Our retire at 55 and retire at 60 guides work through the bridge years.
Widowhood. When one spouse dies, household spending often falls less than income does: one OAS stops, and CPP is replaced by a survivor’s pension that is capped when combined with the survivor’s own CPP. Our CPP survivor benefit page explains the rules.
Newcomers to Canada. OAS is paid at the rate of years in Canada after 18 divided by 40, so 20 years gives half a pension, $381.25 a month at the October to December 2026 rate. CPP depends on your contributions in Canada. A smaller floor means savings must pay more, so a lower rate may be needed. Our OAS for immigrants page covers the residence rules and social security agreements.
Living outside Canada. Withdrawals from an RRSP by a non-resident have 25% tax withheld unless a tax treaty reduces it, and OAS is paid abroad only after 20 years of residence in Canada after 18. Both can change your real spending rate.
Quebec. Quebec residents receive the Quebec Pension Plan. For 2026, the QPP maximum is $1,507.65 a month at 65, $964.90 at 60 and $2,394.15 at 72, because QPP can be delayed to 72. Quebec also withholds 14% provincial tax on RRIF amounts above the minimum, on top of the federal 5%, 10% or 15%.
Retirees with a workplace pension. A defined benefit pension is a floor like CPP and OAS. The larger it is, the less your savings must pay and the more room you have for a cautious rate. Our pension or lump sum guide covers the choice between keeping the pension and taking its commuted value.
9. Common Mistakes and How to Fix Them
Treating 4% as a guarantee. It is a rule of thumb from past US returns. Fix: test a lower return and a bad-years-first path in the calculator before you rely on it.
Mixing real and nominal figures. Using a nominal return with an inflation-adjusted withdrawal makes the money appear to last much longer than it will. Fix: use a return after inflation, as every table on this page does.
Forgetting tax. A 4% spending plan from a RRIF can be a 5% gross withdrawal or more. Fix: gross up the RRSP and RRIF part of your withdrawals for your tax rate.
Ignoring CPP and OAS. Without them, you may save far more than you need, or retire later than you have to. Fix: subtract your floor before applying any rate.
Ignoring fees. A 2% fee turns a 4% real return into 2%, which in our table cuts the life of a 4% plan from 83.1 years to 34.0. Fix: know your all-in fee and use the return after fees.
Spending every RRIF minimum. The minimum rises to 11.92% at 90; spending all of it can drain savings early. Fix: spend to your plan and move the rest to a TFSA or non-registered account.
Never adjusting. A plan set at 65 and never reviewed can drift far from safe. Fix: check your withdrawal against your portfolio every January and follow your adjustment rules.
10. Ten Strategies for a Safer Withdrawal Rate
1. Build the floor first
CPP, OAS and any pension pay for life and rise with inflation. Cover essential spending with them where you can, and let savings pay for flexible spending.
2. Delay CPP and OAS
CPP started at 70 is 42% larger than at 65, and OAS started at 70 is 36% larger. A larger indexed floor lowers the rate your savings must sustain later.
3. Use guardrails
Set a band around your starting rate, such as 20% either side. Starting at 4% of $1,000,000 ($40,000), the band is 3.2% to 4.8%. If the portfolio falls to $760,000, $40,000 is 5.26%, above the band, so you cut 10% to $36,000.
4. Plan on a range
Pick a rate that works at your expected return and one that works at a lower return. Spending between the two gives you room to adjust without a crisis.
5. Hold a cash reserve
Parking one to two years of withdrawals in savings or short GICs lets you avoid selling investments just after a drop. Compare GIC rates and high-interest savings accounts.
6. Cut fees
Every point of fees is a point off your real return. In our table, going from a 1% fee to 0.25% adds $317,648 to the balance after 30 years.
7. Draw in a tax-smart order
Taking RRIF money in low-income years and TFSA money for large costs lowers the gross withdrawal needed for the same spending. See our withdrawal order guide.
8. Recycle unspent minimums
Move after-tax RRIF minimums you do not spend into a TFSA, where growth is tax-free and withdrawals are left out of the income that sets the OAS recovery tax.
9. Consider an annuity for part
A life annuity turns part of your savings into income for life, adding to the floor. Our annuities in Canada guide explains how payments are taxed and protected.
10. Review every January
Update your balance, fees, RRIF minimum and plans. Re-run the withdrawal calculator with a lower return to see your margin, and adjust before small problems grow.
Illustrative Example: A Fixed Plan and a Flexible Plan
This example is hypothetical. Elaine and Victor each retire at 65 with $1,000,000 and start by withdrawing $45,000 (4.5%). Both face the same bad-years-first path, built the way our calculator builds it around a 2% average real return: −13%, −8% and −3% in years 1 to 3, +7% in years 4 to 9, then 2% a year. Withdrawals come out at the start of each year, in 2026 dollars. Each also receives the average new CPP and a full OAS, $19,450.08 a year.
- Elaine keeps $45,000 every year. After year 1 her portfolio is $830,850 (($1,000,000 – $45,000) x 0.87). She keeps withdrawing $45,000, and the money runs out after 25.6 years, during the year she turns 90. In total she withdraws $1,151,490. From then on her income is her CPP and OAS, $19,450.08 a year.
- Victor follows a guardrail. His rule: after a year with a loss, if this year’s withdrawal is more than 20% above his starting rate of 4.5% of the portfolio (so above 5.4%), cut it by 10%. In year 2, $45,000 is 5.42% of $830,850, so he cuts to $40,500. In year 3, $40,500 is 5.57% of $727,122, so he cuts to $36,450. In year 4, $36,450 is 5.44% of $669,952, so he cuts to $32,805. Returns then turn positive, and he keeps $32,805 a year.
- Victor after 30 years. At 95 he still has $280,570, after withdrawing $1,007,685 in total. His income with CPP and OAS fell from $64,450.08 ($45,000 + $19,450.08) to $52,255.08 ($32,805 + $19,450.08), or 18.9%, even though his withdrawal fell 27.1%. The floor softened the cut.
The lesson. Elaine spent more in her first 25 years, then lived on CPP and OAS alone. Victor accepted lower spending after three bad years and kept a reserve past 95. Neither is right for everyone, but the flexible plan turned a rate that failed into one that lasted, which is why a safe withdrawal rate in Canada is best set together with rules for changing it.
Safe Withdrawal Rate Canada FAQ
What is a safe withdrawal rate in Canada?
It is the share of your savings you can take in the first year of retirement, then keep taking in inflation-adjusted dollars, without running out. A common rule of thumb is 4%. In our tables, 4% lasts 34.0 years at a 2% return after inflation and 25.0 years at 0%. The right rate depends on your time horizon, returns, fees and flexibility.
Is the 4% rule still valid in Canada?
It is a reasonable starting point for a 30-year retirement if your portfolio earns about 2% or more a year after inflation and fees. For 35 to 40 years, or lower returns, a rate nearer 3% to 3.5% is more cautious. Canadians should also count CPP and OAS, gross up RRIF withdrawals for tax and plan for RRIF minimums.
How much can I withdraw from $1 million in retirement?
At 4%, $40,000 a year, raised with inflation. To last exactly 30 years with a steady return, the level withdrawal is $33,333 at a 0% real return, $43,774 at 2% and $55,606 at 4%. Add CPP, OAS and any pension on top, and remember that RRIF and RRSP withdrawals are taxable while TFSA withdrawals are not.
How long will $500,000 last in retirement?
It depends on the withdrawal and the return. Taking $20,000 a year (4%) at a 2% return after inflation, $500,000 lasts 34.0 years; taking $25,000 (5%), it lasts 25.1 years. At a 0% real return, $20,000 a year lasts exactly 25 years. CPP and OAS reduce how much the $500,000 itself must pay.
What is sequence of returns risk?
It is the risk that losses arrive early in retirement while you are withdrawing. In our example, $45,000 a year from $1,000,000 with the same ten returns averaging 4% lasts 39.2 years if the bad years come first and 53.7 years if they come last. It matters most when your rate is close to the limit.
Do RRIF minimums force me above a 4% withdrawal rate?
They force you to withdraw more, but not to spend more. The minimum is 5.28% at 71, 6.82% at 80 and 11.92% at 90 of the January 1 value. After tax, you can move what you do not spend into a TFSA if you have room, or a non-registered account, so your spending rate can stay where you planned.
Should my withdrawal rate include taxes?
Yes. A withdrawal rate measures what leaves the portfolio, before tax. In our Ontario example, a 65-year-old with average CPP and full OAS had to withdraw $51,583.72 from a RRIF to add $40,000 of after-tax spending, a 5.16% rate on $1,000,000. From a TFSA, the same spending would be a 4.00% rate.
How do CPP and OAS change my safe withdrawal rate?
They shrink what your savings must pay. With the average new CPP at 65 and a full OAS, $19,450.08 a year comes before savings. On $600,000 at 4%, savings pay $24,000 and the total is $43,450.08 before tax; from the savings alone, that income would take a 7.24% withdrawal rate. Delaying CPP or OAS to 70 raises that floor for life.
What withdrawal rate should early retirees use?
A lower one, because the money must last longer and CPP and OAS start later. At a 2% return after inflation, the level withdrawal that lasts exactly 40 years is 3.58%, and for 50 years it is 3.12%. At a 1% real return, the 50-year rate is 2.53%. Flexible spending rules help early retirees most.
What are guardrails in retirement withdrawals?
Guardrails are rules set in advance for changing your withdrawal when markets move. A common form puts a band around your starting rate, such as 20% either side, and cuts spending by 10% when the current rate rises above the band, or raises it when the rate falls below. They trade some spending in bad years for a lower risk of running out.
How do fees affect a safe withdrawal rate?
Fees come straight off your return. In our example, $40,000 a year from $1,000,000 at a 4% real return lasts 83.1 years with no fees, 44.1 years with a 1% fee and 34.0 years with a 2% fee. After 30 years, a 0.25% fee leaves $784,803 and a 2% fee leaves $156,184.
Where did the 4% rule come from?
It came from US retirement research that tested past US stock and bond returns. Researchers looked for the highest first-year withdrawal, raised with inflation each year, that would have lasted 30 years in the historical periods they studied, and about 4% held up. It reflects past US markets and a 30-year horizon, not a promise about the future.
Set your safe withdrawal rate in Canada with your own numbers: your floor, your accounts, your fees and a margin for bad years.
Our editorial standards explain how we check figures and build our calculators. Every table on this page uses the same method as our withdrawal rate calculator, with returns after inflation and amounts in 2026 dollars.
Figures on this page were checked against Canada Revenue Agency and Service Canada publications on October 28, 2026. We update this page when a figure changes.
Meet the Experts Behind WealthScale

Sharad is a CPA Ontario member (No. 61040184) and a Certified Public Accountant licensed in Washington and Montana, with more than 15 years in accounting and tax, a Diploma in Banking and Finance and a Certificate in Small Business Finance. He checks WealthScale content against primary sources. WealthScale is independent of his firm, Gondaliya CPA Professional Corporation, and provides general information only, not personal financial, investment, tax or legal advice.
- Chartered Professional Accountant, CPA Ontario
- Certified Public Accountant, Washington (No. 57629) and Montana (No. PAC-CPAP-LIC-033176)
- Writing on tax and registered accounts since 2021
- Reader’s Choice Award 2025 Winner, Best Accountant (Toronto)
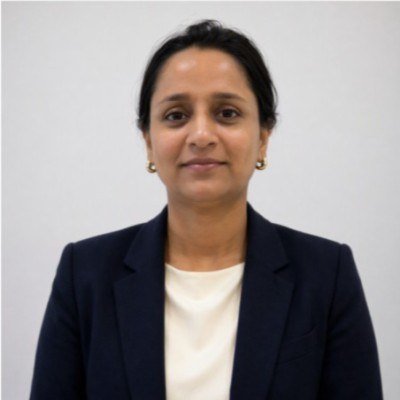
Neha Gupta is a CFA charterholder based in Winnipeg who has worked in financial markets since December 2005. She has published more than 2,600 investment articles and is Head of Operations and Finance at Whiteland Real Estate. She reviews WealthScale’s investing pages for accuracy.
- CFA charter, CFA Institute (awarded 2023)
- Post Graduate Diploma in Business Administration (Finance), 2008
- In financial markets since December 2005
- More than 2,600 published investment articles
General information only. Not financial, investment, tax or legal advice. WealthScale is independent and is published by WealthScale Media Inc., 55 Queen St E, Suite 1205, Toronto, ON M5C 1R6. CFA® and Chartered Financial Analyst® are registered trademarks owned by CFA Institute.